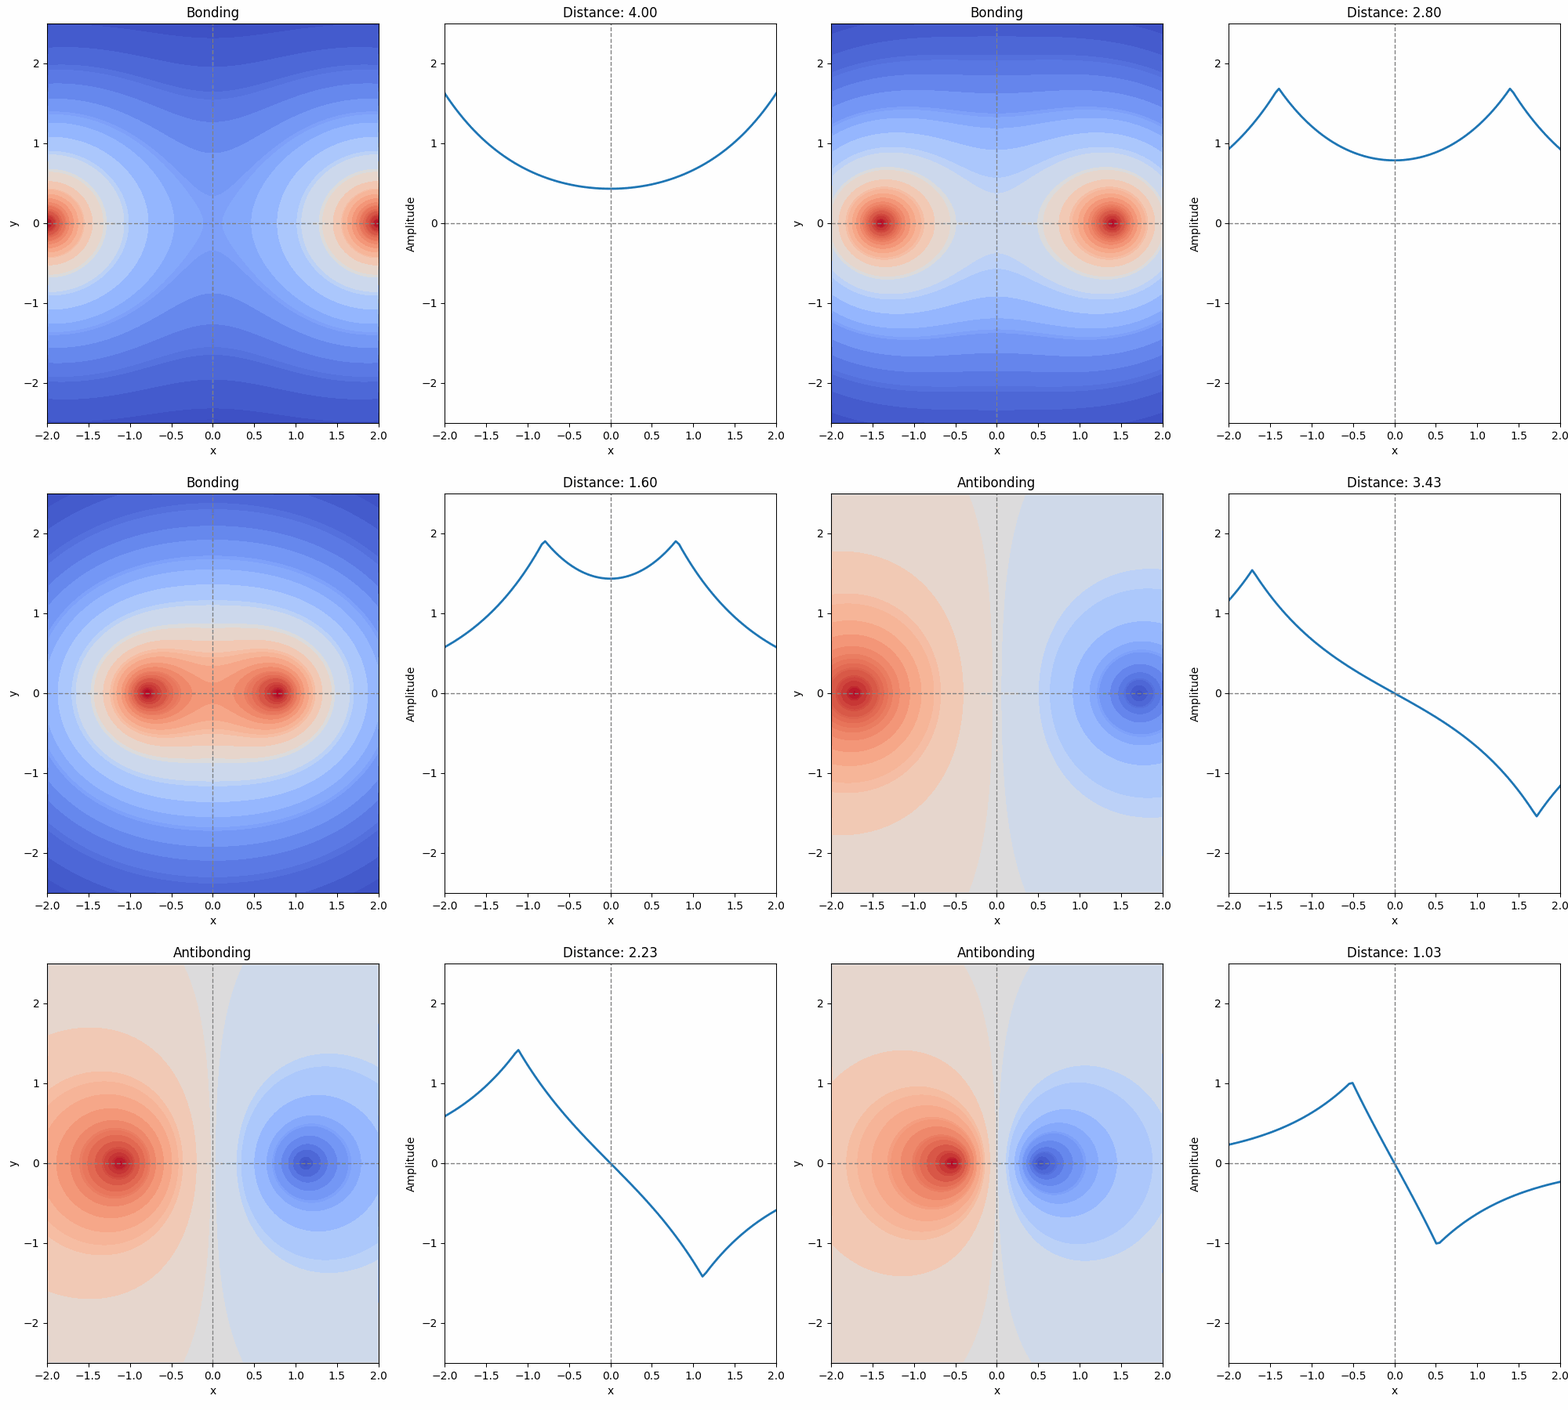
2原子分子の分子軌道ができる様子をアニメーションで見てみよう
この Python コードでは、2つの原子が接近してお互いの軌道が重なり合うことで分子の軌道が形成される様子をアニメーションで描画します。
import numpy as np
import matplotlib.pyplot as plt
import matplotlib.animation as animation
from matplotlib.animation import PillowWriter
from IPython.display import Image

x = np.linspace(-2, 2, 100)
y = np.linspace(-2.5, 2.5, 100)
X, Y = np.meshgrid(x, y)

def atomic_orbital(x, y, center_x, center_y, zeta=1.0):
    r = np.sqrt((x - center_x)**2 + (y - center_y)**2)
    N = (2 * zeta)**1.5 / np.sqrt(np.pi)
    return N * np.exp(-zeta * r)

def bonding_mo(x, y, d, zeta=1.0):
    return atomic_orbital(x, y, -d / 2, 0, zeta) + atomic_orbital(x, y, d / 2, 0, zeta)

def antibonding_mo(x, y, d, zeta=1.0):
    return atomic_orbital(x, y, -d / 2, 0, zeta) - atomic_orbital(x, y, d / 2, 0, zeta)

fig, (ax1, ax2) = plt.subplots(1, 2, figsize=(10, 6))
fig.subplots_adjust(left=0.06, right=0.99, top=0.95, bottom=0.1)

def plot_mo(frame):
    ax1.clear()
    ax2.clear()

    if frame < 100:
        ax1.set_title(f"Bonding")
        d = 4 - frame * 0.03
        contour_plot  = bonding_mo(X, Y, d)
        cross_section = bonding_mo(x, 0, d)
    else:
        ax1.set_title(f"Antibonding")
        d = 4 - (frame - 100) * 0.03
        contour_plot  = antibonding_mo(X, Y, d)
        cross_section = antibonding_mo(x, 0, d)

    ax1.contourf(X, Y, contour_plot, levels=100, cmap="coolwarm")
    ax1.axhline(0, color='grey', linestyle='--', linewidth=1)
    ax1.axvline(0, color='grey', linestyle='--', linewidth=1)
    ax1.set_xlim(-2, 2)
    ax1.set_ylim(-2.5, 2.5)
    ax1.set_xlabel("x")
    ax1.set_ylabel("y")

    ax2.set_title(f"Distance: {d:.2f}")
    ax2.plot(x, cross_section, lw=2)
    ax2.axhline(0, color='grey', linestyle='--', linewidth=1)
    ax2.axvline(0, color='grey', linestyle='--', linewidth=1)
    ax2.set_xlim(-2, 2)
    ax2.set_ylim(-2.5, 2.5)
    ax2.set_xlabel("x")
    ax2.set_ylabel("Amplitude")

ani = animation.FuncAnimation(fig, plot_mo, frames=200, interval=50, repeat=True)

gif = "mo.gif"
writer = PillowWriter(fps=20)
ani.save(gif, writer=writer)

Image(gif)
コードを Jupyter Notebook で実行結果すると、分子軌道を上から見た図(左)と、横から見た図(右)が表示されるはずです。

2つの原子が徐々に近づくとき、分子軌道(結合性軌道と反結合性軌道)がだんだんと形作られていく様子を眺めてみてください。